Source
My last article described how to “
Quickly install Nagios on Ubuntu“. That article had you up and running with the powerful open source network monitoring tool, but not much more. If you really want to make Nagios useful you have to do a bit of work. Some might see this work as too time consuming and or challenging. I can understand that on a large network. Because Nagios can not do auto-discovery, it is up to the admin to configure any device to be monitored. Naturally no admin is going to want to monitor every single device on their network. That works out okay with Nagios. Now, if you are interested in monitoring every single device, on a larger network, you will either need to get clever with some scripting to search out your devices (and track down their associated addresses) or you will need to move on to a different solution.
But for those who only need to monitor a few devices, configuring Nagios to do so is actually quite simple. In this article I am going to show you a few configurations to handle and then how to add devices and checks for your installation.
Post-install configurations and plugins
Before you get busy setting up devices for Nagios to monitor, you should first install some extra plugins for the system. Open up Synaptic, search for “nagios” (no quotes), mark nagios-plugins-extra for installation, and click Apply to install. Once that is done you will already have more functionality with Nagios.
Now let’s take care of a couple of configurations. The first is in the /etc/nagios3/conf.d directory. The file is called contacts_nagios2.cfg. In this file you will configure who is to receive the email alerts. The line to set this configuration is:
email root@localhost
You will want to change that email address. That is it for this configuration file. Now in order for Nagios to be able to send out alerts via email, the machine housing Nagios has to be able to send those alerts out. You can check that by using the mail command like so:
mail email@address -s TEST
Where email@address is an actual address you can use for testing.
Once you enter that line, hit Enter and then type some random text. When you’re done typing hit d and then Enter. The mail should send away. If not you will have to troubleshoot your mail server (beyond the scope of this tutorial).
Add a device

Figure 1
Now for the good stuff. We are going to add a device to Nagios.
The device we will add is a Windows XP desktop to monitor.
Within the /etc/nagios3/conf.d directory you will see a number of .cfg files. These are the files Nagios uses to dictate what is see and how it acts upon what it see. For every device you want to use, I find it best to add a .cfg file. So let’s create the file /etc/nagios3/conf.d/windows_xp.cfg. The contents of this fill will look like what you see in Figure 1.
As you can see there are a few directives here. The directives are as follows:
- check_command – The command used to check the status of the device.
- max_check_attempts – How many times will Nagios retry the status check.
- check_period – How often are the checks made.
- process_perf_data – Enable the processing of performance data.
- retain_nonstatus_information – Enable the retention of non-status information across reboots.
- notification_interval – How often are notifications sent to inform the administrator this host is not okay.
- notification_period – How often are notifications sent out.
- notification_options – The options shown are w – send notifications on “warning” state, u – send notifications on “unknown” state, and “r” – send notifications when a service stops flapping (when a service changes frequently).
NOTE: Depending upon the version of Nagios you have installed the notification_options will be different. Some instances will not accept the “w” option. If you get an error, exchange “w” with “d” (for down).
As you can see there are configuration options that will be specific to your devices and networking topology (host_name and address are examples). Once you have created this file save it and restart Nagios with the command sudo /etc/init.d/nagios3 restart command. Now take a look at your Nagios page and you will see the new device you just added.
Final thoughts
Someday someone will come up with an automated way to detect devices in Nagios. Until then we are relegated to adding them using this means. Does that mean you should shy away from Nagios? Not at all. Nagios is a powerful tool ready to help network administrators keep tabs on their network devices.


 Easily set monitors for anything you like – from how much disc space a device has left to whether or not a server is online. If Spiceworks collects info on it, you can monitor it!
 Whether you need to see a chart or graph of your overall network state; a detailed alert specific to a single device; or would like to receive an email the next time a user downloads a specific application – it’s easy to get the alerts you want when you need them!
 From the message load on your Exchange server to the size of your users’ inboxes – Spiceworks provides a thorough overview that’ll keep you in step with your email health and usage. You can even monitor, add and edit Rackspace hosted email accounts right from Spiceworks!
 There seems to be a constant battle between network admins trying to keep the network moving quickly, and users trying to create bottlenecks with excessive bandwidth usage. With our bandwidth monitoring utilization tools, you can locate bottlenecks, see the top users, and find problem areas on a wide range of network devices. You can also set up alerts to notify you when Windows & Mac devices that have been scanned properly are exceeding a set limit of bandwidth usage.
 Set up and view alerts for Windows events that occur across your environment - so you can easily use Spiceworks to detect, diagnose and troubleshoot any issues that might disrupt your network performance.
 Get real-time performance monitoring of all of your Windows devices - from overall health to performance counters like disk and processor queue lengths.
 Spiceworks will monitor the S.M.A.R.T. (Self-Monitoring, Analysis & Reporting Technology) status of your Windows hard drives so you can get alerts when issues emerge. A drive that unexpectedly fails can be disastrous, so you want to get a heads up for any potential problems as soon as possible. When S.M.A.R.T. anticipates a failure, you’ll receive an alert in your email and on your Spiceworks Timeline. That way, you can replace the drive, and possibly return it to the manufacturer.
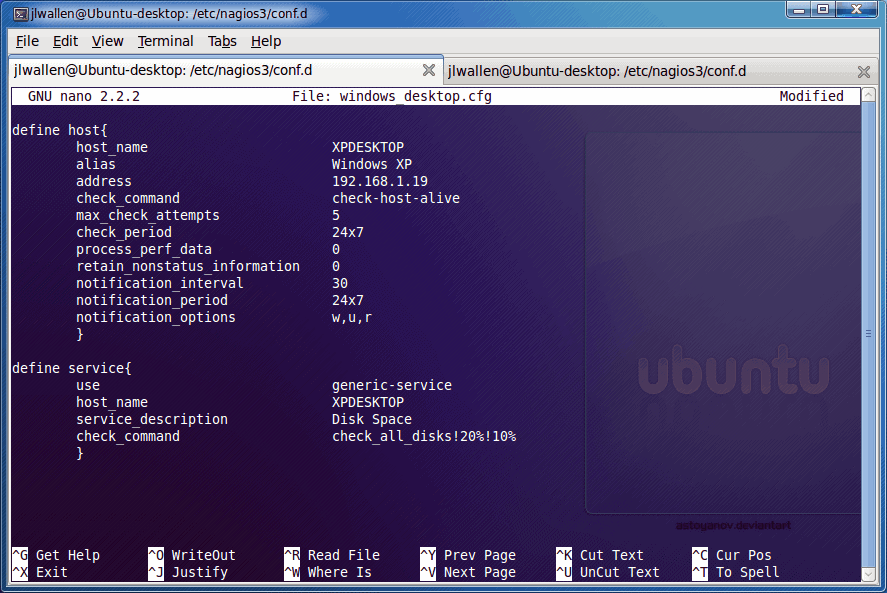
")


 LibreOffice
 Firefox
 OpenSUSE


