Bienvenido! - Willkommen! - Welcome!

Bitácora Técnica de Tux&Cía., Santa Cruz de la Sierra, BO
Bitácora Central: Tux&Cía.
Bitácora de Información Avanzada: Tux&Cía.-Información
May the source be with you!
Showing posts with label tests. Show all posts

Saturday, June 29, 2013

Anti-Virus Comparative File Detection Test 2013

Anti-Virus Comparative - File Detection Test - March 2013 www.av-comparatives.org 
AV Comparatives e.V. is a registered Austrian Non-Profit-Organization
The Malware sets have been frozen the 22nd February 2013 and consisted of 136610 sample variants.The products were updated on the 28th February 2013 and tested under Microsoft Windows 7 64-Bit. 
 
1 We additionally tested also Windows Defender included in Windows 8 (we observed the same results as
achieved by Security Essentials under Windows 7).
2 We added Symantec Norton in this test, even if they did not apply for being included into our test-series, as the results have been highly demanded by our readers and the press.
3 Information about used additional third-party engines/signatures inside the products:
BullGuard, Emsisoft, eScan and F-Secure are based on the Bitdefender engine
The tested version of GDATA (2013) was based on the Avast and Bitdefender engines
G DATA 2014 is based on the Bitdefender engine; the results in this report of G DATA 2013 are not applicable to G DATA 2014

Monday, June 3, 2013

Antivirus que usan menos recursos de procesamiento y memoria

Los antivirus que menos ralentizan el PC – AV-Comparatives May2013
AV-ComparativesEl laboratorio independiente AV-Comparatives ha publicado su último informe en Mayo 2013, sobre el impacto que tienen las principales soluciones antivirus del mercado en el rendimiento de los ordenadores en comparación con el AV de Microsoft Security Essentials.
Este es uno de los tres principales puntos (Protección, Desinfección y Rendimiento) que buscan los usuarios a la hora de decidirse por ¿Cuál es el mejor Antivirus? para proteger sus equipos y que curiosamente la gran mayoría considera al ‘Rendimiento’ (consumo de recursos) como el factor principal a la hora de su decisión…
AV-Comparatives ha analizado un total de 21 productos antivirus disponibles en el mercado, instalados en equipos Intel Core i5-3330 con 4 GB de RAM corriendo bajo Windows 7 Professional SP1 64-Bit.

Las pruebas realizadas incluyen distintos procesos habituales para detectar cómo afecta en el rendimiento de los sistemas cada uno de los antivirus en ejecución. Así, AV-Comparatives ha ido lanzando tests de copia de ficheros, archivado, codificación multimedia, lanzamiento de aplicaciones, descarga de archivos…
Los antivirus que menos impactan en el rendimiento de los sistemas son F-Secure, Kaspersky y Sophos, a los que le siguen ESET, avast!, Symantec y BitDefender.
Los antivirus que menos ralentizan el PC según AV-Comparatives son:
Los datos mostrados se comparan con la solución antivirus de Microsoft Security Essentials y tal como se puede apreciar en el gráfico, hasta siete soluciones han mejorado el rendimiento en el impacto en el sistema, mientras que el resto Avira, Panda, AVG, G Data y McAfee, consumen más recursos que dicho software.
Los antivirus que más ralentizan el ordenador
Las comparativas de Antivirus son una importante referencia a la hora de elegir el producto adecuado para proteger nuestros PCs, aunque como siempre solemos decir en @InfoSpyware, ni esta ni ninguna otra comparativa será absoluta!
Recuerden que incluso las mejores soluciones antivirus no pueden protegernos al 100%, eh inevitablemente van a consumir recursos que pudieran ralentizar nuestro ordenador (aunque se ha avanzado muchísimo en este aspecto) a lo que va a depender en cada caso del hardware y la configuración de nuestros sistemas en que notemos una degradación o mejora en el impacto de cada uno de los AVs.
.Más información sobre el estudio (versiones de las soluciones antivirus utilizadas y metodología…) en este documento en PDF.
==========================
http://www.forospyware.es/foro-virus-spywares/1679-pruebe-realmente-antivirus-protegiendo.html

Tuesday, June 19, 2012

Virus Bulletin RAP

Source
The VB RAP (Reactive And Proactive) test has been running as part of the bi-monthly VB100 comparative reviews since February 2009. The test measures products' detection rates over the freshest samples available at the time the products are submitted to the test, as well as samples not seen until after product databases are frozen, thus reflecting both the vendors' ability to handle the huge quantity of newly emerging malware and their accuracy in detecting previously unknown malware.
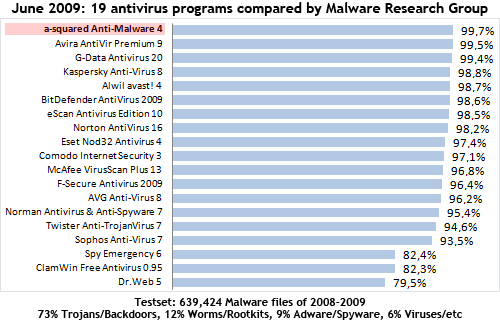
The following chart shows average scores achieved in the last four comparative reviews:
RAP averages quadrant October - April 2012
In the compilation of this chart, any RAP score achieved in a test in which the product in question generated one or more false positives is NOT counted towards that product's average score. Products that entered only one of the comparatives used to generate the chart (or for which only one set of results are counted due to false positives in other tests) are marked in RED - this indicates that the score may be considered less reliable an indicator of detection capability than those for whom an average of measures across several tests are available.

Procedures

The RAP tests are run according to the following procedures:
RAP samples are split into four sets. The set known as 'week +1' is gathered in the period from one to seven days after the product submission deadline. The 'week -1' set covers the deadline day itself and the six previous days. The 'week -2' set includes samples gathered eight to 14 days before the deadline, and the 'week -3' set consists of samples gathered 15 to 21 days before the deadline.
All samples are counted as dating from the point at which they are first seen by the Virus Bulletin test lab processing systems, or the date label of the batch with which they were received, whichever is earlier. Sample sources are not considered when compiling sets.
Samples are validated using our standard lab protocols, and classified to exclude certain inappropriate sample types. These include adware and other items considered 'potentially unwanted' by some products, partial samples requiring other components to operate, and original samples of true viruses received from external sources. Self-replicating viruses are replicated in-house and only new replications are considered for inclusion in the RAP sets.
Samples are rated by prevalence and significance as accurately as possible, using prevalence data from a wide range of sources. Sets are weighted to remove the least prevalent items. Scores are also weighted to minimise the impact of large quantities of similar items - for example, large batches of server-side morphed trojans and replicated true viruses are given a lower weighting than one-off unique items.
For each product entered for a review, we measure detection using our standard on-demand scanning procedure; this uses default product settings and ignores detections labelled as 'suspicious' only. Scores used in the per-test RAP quadrants are labelled 'Proactive' (the 'week +1' score) and 'Reactive' (the average of the scores for weeks -1, -2 and -3). Scores used in the four-test RAP averages quadrant are the averages of each score over the last four tests.
In the per-test quadrants, products with false positives in the test in question are marked by striking through the product identifier. For the four-test RAP averages quadrant, such scores are excluded when calcuating averages.
Product identifiers on quadrant charts may be simplified or abbreviated to keep the chart readable.

Tuesday, August 2, 2011

AV-Comparatives.org and M

On this site you will find independent comparatives of Anti-Virus software. All products listed in our comparatives are already a selection of some very good anti-virus products. In order to get included in our main tests, vendors must fulfill various conditions and minimum requirements.
Products of the following vendors are included in our comparatives 2011:
G DATA
K7
Kaspersky

McAfee

Microsoft
Panda

PC Tools
Single Product Reviews 
Whole Product Dynamic Test Overall Result 2010 Report (English)
 Whole Product Dynamic Test December 2009 Report (English)
http://chart.av-comparatives.org/chart2.php
Detection Tests
===================================
malwareresearchgroup.com/

Wednesday, October 20, 2010

ATTO Disk Benchmark

Source
Newer version available: ATTO Disk Benchmark v2.46

Aged but very popular harddisk benchmarking tool. Offers nice features to benchmark RAID setups.

Screenshot

Saturday, July 24, 2010

Boot time of Ubuntu versions

Tests realizados a un Dell Mini 9 con procesador Intel Atom N270 @ 1,6GHz:
  • 59 segundos Tiempo de arranque de Ubuntu 9.10 Karmic Koala
  • 24 segundos Tiempo de arranque de Ubuntu 10.04 Lucid Lynx Alpha

Ubuntu 10.04 Already Shortens The Boot Time

Published on December 18, 2009
Written by Michael Larabel

Ubuntu 10.04 Alpha 1 was released last week and while it did not bring any major features yet for this Long-Term Support release of Ubuntu Linux to be released in April of 2010, it began to introduce some underlying changes like the switch to the Linux 2.6.32 kernel, X Server 1.7, and the complete removal of HAL. Our early benchmarks of Ubuntu 10.04 show that there are some negative performance regressions right off the bat, but that is from within the Linux desktop. One area that Canonical is focusing upon in particular with Ubuntu 10.04 LTS is speeding up the boot process, so we decided to provide some benchmarks there too.
For Ubuntu 10.04 in fact they would like a 10 second boot time for Intel netbook hardware. Not only are they speeding up the boot process, but they are also working to beautify the boot process with Plymouth (video). For this article we checked out the boot performance with a Samsung NC10 that had an after-market OCZ SSD and 2GB of RAM along with a stock Dell Mini 9. Starting off, below are the Dell Mini 9 boot chart results for clean installations of Ubuntu 9.10 and then Ubuntu 10.04 Alpha 1.
The reported boot time for Ubuntu 9.10 on the Mini 9 was 59 seconds, but only 24 seconds in comparison for Ubuntu 10.04 Alpha 1. In the past, we had been able to boot Ubuntu 9.10 faster, but these are clean Bootchart results from Ubuntu 9.10 on a stock installation. The peak disk throughput was also higher under Ubuntu Lucid with a speed of 84MB/s compared to 79MB/s with Karmic. With Ubuntu 10.04 Alpha 1 there are less process starting up (such as with HAL being completely nuked) and the processes that are running are running faster. Also, we were measuring the boot chart results for each system and each Ubuntu release with an automated log-in to the GNOME desktop rather than the log-in screen. Below are the charts for the Samsung NC10.
For the Samsung NC10 the Karmic number was 55 seconds compared to 23 seconds with Lucid. The disk throughput for this OCZ Core Series V2 SSD was also noticeably better with Lucid at a peak of 122MB/s compared to 55MB/s with the stable Karmic.
Also surfacing this month is a new kernel (though it is currently based upon Linux 2.6.31 for Ubuntu 9.10) that pulls in more of Intel's Moblin speed patches from their kernel. As most know, Moblin 2 boots extremely fast. As is described on the mailing list, these kernel patches from Moblin remove a time delay in waiting for all devices before mounting the root file-system, KMS after SATA in drivers, don't blank the display, in the kernel DRM removing a root requirement for a DRM ioctl, fixing a vblank delay on pipe disable, make the device initialization go a-synchronously, and add an EDID cash for connected displays. We have tested out this kernel with the Moblin patches on Ubuntu 9.10 and it booted three seconds faster compared to the stock Karmic kernel.

Sunday, August 16, 2009

intel Core i7 - Core 2 y AMD Phenom X4

Source (texto con imprecisiones técnicas corregidas y eliminación de redundancias)

En la tecnología de procesadores, el cambio estructural más importante es la interfaz QuickPath (QPI) . El QPI ha sido desarrollado para reemplazar el envejecido FSB (Front Side Bus) y ofrecer una vía más rápida de comunicación entre el procesador y el chipset. Obviamente el chipset debe tener soporte para la tecnología QPI y es aquí donde entra el X58 que reemplaza al X48.
Un FSB universal tiene un multiplicador para lograr la frecuencia deseada.
Con QPI Intel introduce una sola frecuencia base de 133,33MHz.
Cada componente en la tarjeta madre utiliza su propio multiplicador para determinar la frecuencia. Para dar un ejemplo práctico, el Core i7 940 opera a 2,93GHz y utiliza un multiplicador de 22x (22 x 133 – 2926MHz).

A diferencia de los procesadores convencionales que usan un solo multiplicador, el Core i7 965 Extreme Edition por ejemplo ofrece un modo especial llamada “Turbo Mode”. Cuando se activa, este permite que el usuario designe un multiplicador independiente para cada uno de los cuatro núcleos.
Para un overclocking es posible aumentar sólo la frecuencia del primer núcleo, que es el más utilizado.
La memoria también funciona de una manera similar, utiliza como base la frecuencia 133,33MHz con un multiplicador para la frecuencia adecuada.
Por ejemplo, la plataforma Core i7 utiliza memoria DDR3-1066 por lo que se necesita en multiplicador 8x para llegar a esa frecuencia. Esto realmente simplifica el overclocking al aumentar la frecuencia de trabajo de los componentes tan sólo modificando la frecuencia central de 133,33MHz o ajustar la frecuencia de cada componente a través de su multiplicador individual.
Este aumento de frecuencia de trabajo, simplificado junto con un ancho de banda más amplio entre el procesador y el chipset son mejoras impresionantes, pero hay algo mas que estaba siendo limitado por el FSB: la memoria. Para resolver este problema Intel finalmente hizo lo que AMD viene haciendo hace años, mover el controlador de memoria al procesador central. El nuevo controlador empotrado en los procesadores “Bloomfield” Core i7 tiene soporte para tres canales de memoria DDR3.
Anteriormente el FSB de 333MHz de los procesadores de alto desempeño Core 2 limitaba el ancho de banda a 10,6GB/s mientras que la memoria DDR2-1066 en modo de dos canales tiene un pico de 17GB/s. Para poder romper esta barrera Intel tenía que eliminar el FSB y decidió seguir el enfoque de AMD para solucionar este problema.
El desarrollo de un controlador de memoria DDR3 de tres canales fue un logro de Intel. Con módulos de memoria DDR3-1066 este controlador logra un pico de 25,5GB/s. Al utilizar módulos DDR3-1333 el ancho de banda máximo es 31GB/s.
Con esta transferencia impresionante el controlador soporta tres canales de memoria y permite dos DIMMs por canal. Las placas base pueden implementar tres o seis ranuras DIMM en vez de las configuraciones típicas de dos o cuatro ranuras.
Los procesadores Core i7 sólo tienen soporte para memoria DDR3. El Core i7 es un procesador con un dye donde los cuatro núcleos, el controlador de memoria, y todos los caches están en un mismo chip.
Los tres procesadores Nehalem tienen un cache L3 de 8MB, y cada de los cuatro núcleos tienen su propio cache L2 de 256KB. En total cada uno de estos procesadores cuenta con unos 731 Millones de transistores y un diseño termal de 130W.
Para darle el toque final, la tecnología hyper-threading está implementada en los procesadores Core i7, lo cual permite que estos chips de cuatro núcleos manejen un total de ocho hilos. Ésta es la misma tecnología usada en los antiguos procesadores Netburst Pentium 4 que desapareció con el lanzamiento de la línea Core 2.
El sistema operativo mostrará ocho núcleos.
El futuro de los procesadores Core i7
Los chips Nehalem vendrán en diferentes versiones, unos para computadoras de escritorio, otros para servidores e incluso unos para computadoras portátiles. La primera serie de la marca Core i7 salió bajo el nombre ‘Bloomfield’ y sus procesadores ofrecen cuatro núcleos, 45nm y tecnología Hyper-threading.
También están siendo desarrollados los procesadores Westmere, Clarkdale, Beckton, Gainestown, Lynnfield, Clarksfield, Havendale, y Auburndale.
Los Beckton serán procesadores de cuatro zócalos para servidores, los Gainestown de dos zócalos.
En cuanto a computadoras de escritorio, eventualmente los tres procesadores Bloomfield serán reemplazados por los procesadores Westmere que ofrecerán varias mejoras.

Los procesadores de alto desempeño basados en el núcleo Westmere tendrán seis núcleos (12 hilos) y serán fabricados usando un proceso de 32nm. Además estos procesadores contarán con un cache L3 compartido de 12MB, serán capaces de utilizar una memoria DDR3 mejorada de cuatro canales y tendrán un bus QuickPath 4x. Se espera que estos chips estén listos para finales de 2009 o comienzos del 2010.
Los procesadores Bloomfield de hoy como los Westmere están diseñados para ser utilizados con el nuevo zócalo LGA1366 que no es compatible con el LGA775.
Sin embargo, otros procesadores para computadoras de escritorio como los Lynnfield y Havendale no usarán el zócalo LGA1366. Utilizarán el zócalo LGA1156. Es interesante que una vez más Intel decidiera lanzar dos zócalos diferentes, pero tal vez no sea lo más conveniente para el consumidor. Cuando los procesadores Lynnfield y Havendale salgan a finales del 2009 se supone que solo tendrán soporte para memoria DDR3 de dos canales y por ende serán una buena opción para los que busquen armar equipos económicos.
Inevitablemente habrá una versión para portátiles de los procesadores Nehalem para finales del 2009. El desempeño de los procesadores móviles (Clarksfield) será muy similar al de los procesadores para computadoras de escritorio Lynnfield, lo cual significa que serán chips de cuatro núcleos con cache L3 de 8MB y soporte para memoria DDR3 de dos canales.
Otro procesador para portátiles que será muy interesante es el ‘Auburndale’. Aunque éstos serán procesadores mainstream de dos núcleos con cache L3 de 4MB con un GPU Ironlake incorporado. Se espera que éste sea el primer chip de Intel en combinar el CPU y el GPU en un mismo chip.

Comparación de arquitecturas Intel y AMD

Configuración HW
intel Core i7

- Intel Core i7 965 Extreme Edition (LGA1366)
- Intel Core i7 940 (LGA1366)
- Intel Core i7 920 (LGA1366)
Módulos de memoria
- x3 Samsung
1GB DDR3-1066
(CAS 7-7-7-20)
chipset
- Intel DX58SO (Intel X58) Pre-Producción

Fuente
- OCZ GameXStream (700 watt)
Disco rígido
- Seagate 500GB 7200-RPM (Serial ATA300)
- video ASUS GeForce GTX 280 (1GB)
Software
- Microsoft Windows Vista Ultimate SP1 (64-bit)
- Nvidia Forceware
180.43 Beta
Configuración HW intel Core 2
- Intel Core 2 Quad Q9650 (LGA775)
- Intel Core 2 Duo E8600 (LGA775)
- Intel Core 2 Duo E6700 (LGA775)
Módulos de memoria
- x2 Kingston HyperX 2GB DDR3-1333
(CAS 7-7-7-20)
chipset
- ASUS Rampage Extreme (Intel X48)

Fuente
- OCZ GameXStream (700 watt)
Disco rígido
- Seagate 500GB 7200-RPM (Serial ATA300)
- video ASUS GeForce GTX 280 (1GB)
Software
- Microsoft Windows Vista Ultimate SP1 (64-bit)
- Nvidia Forceware 180.43 Beta
Configuración HW AMD Phenom X4
- AMD Phenom X4 9950 (AM2+)
- x2 Kingston HyperX 2GB DDR2-1066 (CAS 5-5-5-15)
- ASUS M3A79-T Deluxe (AMD 790FX)
- OCZ GameXStream (700 watt)
- Seagate 500GB 7200-RPM (Serial ATA300)
- ASUS GeForce GTX 280 (1GB)
Software
- Microsoft Windows Vista Ultimate SP1 (64-bit)
- Nvidia Forceware 180.43 Beta

Integrar el controlador de memoria en el dye (chip) ha dado resultados positivos para el Core i7 920 que logró en SiSoftware Sandra un ancho de banda para la memoria de 17GB/s usando nada más que la memoria DDR3 de 1066MHz. Correr tres de estos módulos en modo de tres canales tiene enormes beneficios en cuanto a desempeño se refiere.
El Core i7 940 con una velocidad ligeramente superior aumento el desempeño en 1 Gbit/s para igualar al Core i7 965 Extreme Edition.
El overclock del Core i7 965 EE junto con la memoria DDR3 permitió un ancho de banda para la memoria de 21GB/s!.
Cuando se lo compara con el Core 2 Quad Q9650 con memoria DDR3-1333 de dos canales, el Core i7 920 entrega dos veces más ancho de banda.
Aunque el Phenom X4 9950 también tiene el controlador de memoria en chip... su limitado FSB sólo le permite llegar a 10GB/s.
En la prueba aritmética de desempeño del procesador el Core i7 920 fácilmente supera al Core 2 Quad Q9650. En esta prueba el Core i7 920 entregó 60% más desempeño en la prueba whetstone, y un 24% más en la prueba dhrystone. Por lo tanto, los procesadores Core i7 simplemente aumentan su desempeño en relación directa a su frecuencia.
La prueba multi-media SiSoft Sandraindica que los procesadores Core i7 ofrecen significativas ventajas de desempeño en relación a los procesadores Core 2 y Phenom X4.

El Core i7 920 fue 17% más rápido que el Phenom X4 9950 en la prueba multi-media float, y un 21% más rápido en la prueba multi-media int.
Una vez más el desempeño aumenta en relación directa con la frecuencia del procesador, y aumentar la frecuencia de trabajo del Core i7 965 Extreme Edition tuvo un impacto notable en su desempeño: funcionando a una frecuencia de 3,88GHz es un 38% más rápido que el Core i7 920.
Con esa frecuencia la a entre los núcleos llego a unos increíbles 45GB/s.
La escalabilidad es una mejora notable en la architectura Core i7.
A pesar de ser 670MHz más lento que el Core 2 Duo E8600, el Core i7 920 en realidad fue 100KB/s más rápido en la prueba de un solo hilo. Cuando vemos el desempeño de varios hilos que tuvo el Phenom X4 9550 podemos apreciar que fue superado por el Core 2 Quad con 1567KB/s. El Core i7 920 que logró 76% mas desempeño. Este procesador fue superado por el 940 que logró un desempeño 10,5% más rápido.

Leer más resultados del banco de pruebas

Wednesday, August 12, 2009

av-comparatives.org

On av-comparatives.org you will find independent comparatives of Anti-Virus software. All products listed in our comparatives are already a selection of some very good anti-virus products. In order to get included in our main tests, vendors must fulfill various conditions and minimum requirements.
The following products are tested in the current main comparatives:

avast! Professional Edition 4.8
AVG Anti-Virus 8.0
AVIRA AntiVir Premium 8.2
BitDefender Antivirus 2009
eScan Anti-Virus 10
ESET NOD32 Anti-Virus 3.0
F-Secure Anti-Virus 2009
G DATA AntiVirus 2009

Kaspersky Anti-Virus 2009
Kingsoft Antivirus 2009
McAfee VirusScan Plus 2009
Microsoft Live OneCare 2.5
Norman Antivirus & Anti-Spyware 7.10
Sophos Anti-Virus 7.6.4
Symantec Norton Anti-Virus 2009
TrustPort Antivirus 2.8

Look into the Comparatives section to find out additional tests and reviews.
The main comparative reports are usually published during the following months:
  • March and September: comparative results of on-demand detection of virus/malware
  • June and December: retrospective/proactive test results

34 virusscanners getest

Source: http://security.nl/artikel/22931/1
34 virusscanners getest, G-Data, Avira, F-Secure en Norton bovenaan
01-09-2008
Nu de eerste "2009 Internet Security Suites" verschijnen, heeft het Duitse testorgaan AV-Test 34 virusscanners getest. Naast bekende tests met meer dan 1 miljoen besmette en 2,5 miljoen schone bestanden, keek men ook naar de prestaties van de scanner en de snelheid waarmee updates beschikbaar komen. Volgens Andreas Marx, directeur van AV-Test, moeten consumenten niet alleen op de detectie score letten. "Dit geeft de gebruiker een beperkt en misleidend beeld van wat het product kan. Pas als je alle onderdelen bij elkaar optelt kun je tot een goed oordeel komen. Daarom zijn goede heuristiek en responstijden net zo belangrijk."
...
Voor het testen van de detectiegraad gebruikte AV-Test 1,1 miljoen exemplaren en daar zaten geen "historische" exemplaren tussen. Veel anti-virusbedrijven stoppen met detectie van bepaalde oude malware om hun database handelbaar te maken. Van de 34 scanners wisten er slechts 6 minder dan 85% van de aangeboden malware te herkennen. Naast malware werden de virusscanners ook getest met een verzameling van 95.000 exemplaren spyware en adware. De detectie van spyware door gratis virusscanners, zoals die van AntiVir en AVG is zeer beperk, en ligt onder de 15%. In het overzicht zijn dan ook de commerciële versies opgenomen.
Dit keer werd ook gekeken naar de tijd die anti-virusbedrijven nodig hebben om een update uit te brengen. Dat zou binnen twee uur moeten kunnen zijn. Op CA na weet elk anti-virusbedrijf binnen de acht uur een update te te verspreiden. In het onderstaande overzicht hebben we zelf een "totaal" tabel toegevoegd waarbij de we punten van elke virusscanner hebben opgeteld. Daar komen drie producten als beste uit de bus. Symantec Norton Internet Security 2009, Avira Premium Security Suite 2008, G Data Internet Security 2009, F-Secure Internet Security 2009 en Webwasher Gateway 6 wisten elk 28 punten te halen. Webwasher en G Data zijn multi-engine scanners, waarbij Webwasher die van Avira en zichzelf gebruikt. G Data gebruikte vorig jaar nog die van Avast en Kaspersky, maar is nu overgestapt op die van Avast en BitDefender, wat tot betere prestaties leidt.


Update: titel aangepast, F-Secure en Avira toegevoegd

Tuesday, June 16, 2009

AMD Phenom-ene: X3 vs. X4

Quelle


Vergleich von 3 AMD Prozessoren
Phenom X3 8450 vs. Athlon X2 6400+

Thursday, March 5, 2009

Games: CPU scaling with dual & quad core processors

Read that before
The Verdict
So then, the hardcore truth today is a very simple fact: you'll gain a better bang for buck in your games from a faster clocked dual-core processor opposed to having a somewhat slower clocked quad-core processor. That doesn't mean though that quad-core processors offers less value. Contrary, and I know I've been evangelizing it for over a year now, but the future is multi-core gaming, the fact is just that dual-core is the sweet spot value wise anno 2008 as 95% of the games still only use one and maybe two CPU cores.
Why did you not use a GeForce 9800 GX2 you ask? Well, actually we did. Yet on the Phenom platform we noticed that in several occasions the second GPU on that card did not work, feeding back improper results. This is why I like Single-GPU solutions so much. The next fastest card in line was the GeForce 8800 Ultra.
When we look purely at the quad-core processors used in this review, it's quite interesting to see what the effect of the platform difference between AMD Phenom and Intel Core 2 processors. We compared the two quite a lot in the past already, yet with more affordable graphics cards in the mid-range segment. Surely, in the high-end segment a faster graphics card obviously needs to be paired with a faster processor to form a nice symbiosis between the two, more frames per second equals more date for the CPU to present to the GPU drivers. It's a simple matter of 1+1=2
2,4,8,16 cores ... right now it seems that after 2 cores it does not seem to matter that much how many cores you have in your PC when it comes to gaming. Our recent Intel Skultrail review (8 logical CPU cores) proved that already. The biggest bang for your buck is a faster Core 2 Duo dual-core processors preferably with a higher clock frequency. Next in line are the cheaper quad-core processors. But after four cores guys, I tell you, with the pending Intel Nehalem release going 6, 8 and maybe even more cores, we are bound to run into an issue. More transistors means more costly products. What really needs to go up is that processors frequency.
Though AMD offers price wise a slightly more affordable Quad-core solution, we can not deny and ignore the fact Core 2 Quad is the faster processor. Especially the new Core 2 Quad 45nm Penryn based processors offer a little extra punch. The QX9770 kicks ass in every foreseeable segment, but unfortunately it's downright expensive. No, the winner in this article has to be the 45nm Penryn based Core 2 Quad Q9450. At 300 USD this processor offers leading performance at a leading price. Here in the Netherlands this processors costs slightly over 250 EUR, and is as far as I am concerned a very interesting purchase.
But anno 2008, comparing apples to oranges, unless you are really into 3DMark ... the Core 2 Duo dual-core processors, looking at it from the gaming perspective offer the best value for your money. And when we focus on pure raw performance, the new 45nm Penryn Quad cores processors just haul ass big-time with truly grand performance; and that's the cold core truth.
We like to thank both AMD & Intel for supplying us with the processors needed for this article.


Tuesday, October 21, 2008

Monitor Test [simple - vereinfacht)

Si puede ver aquí todos los 20 niveles grises claramente separados, su monitor está calibrado correctamente (hacer doble click sobre la cuña de grises) [brillo y contraste]
If you can see here all 20 levels of grey clearly separated, your monitor is calibrated correctly! (double click on grey scale)
Wenn Sie alle 20 graue Rechtecke dieses Graukeiles deutlich auseinander erkennen, ist Ihr Monitor richtig eingestellt (Helligkeit und Kontrast)


Sunday, October 12, 2008

Firewalls: Basic Security Audit

Auditing Features
Basic Security Audit performs a port scan of 1500+ known-service ports (all ports from 0-1024, along with a set of ports that are known to host a variety of services and possible trojans) of an IP for open ports and possible trojansmust surf from the IP to be audited
Reports
provides detailed and comprehensive information on open ports found, along with the steps on how to fix them
Pricing:free
Run Test To run a Basic Audit, you need to login in as a
registered user. Please fill the appropriate form below (upon
successful login, the form to run an audit will be presented).
Register here

The Top 100 Products 2007

Source
In ranked order
  1. Google Apps Premier Edition Review | Vendor Site
  2. Intel Core 2 Duo Review | Check Prices
  3. Nintendo Wii Review | Check Prices
  4. Verizon FiOS Vendor Site
  5. RIM Blackberry 8800 Review | Check Prices
  6. Parallels Desktop Review | Check Prices
  7. Pioneer Elite 1080p PRO-FHD1 Check Prices
  8. Infrant Technologies ReadyNAS NV Check Prices
  9. Apple Mac OS X 10.4 "Tiger" Review | Check Prices
  10. Adobe Premiere Elements 3 Review | Check Prices
  11. Apple TV Review | Check Prices
  12. Samsung SyncMaster 244T Review | Check Prices
  13. BillP Studios WinPatrol Download
  14. HP dv9000t Review | Check Prices
  15. McAfee SiteAdvisor Download
  16. Canonical Ubuntu 7.04 Review
  17. Pandora.com Review
  18. Microsoft Xbox 360 Elite Review | Check Prices
  19. Paint.net Download
  20. Hitachi Deskstar 7K1000 Review | Check Prices
  21. SightSpeed 6 Download
  22. Kayak Web Site
  23. Nikon D40X Check Prices
  24. New York Times Times Reader Vendor Site
  25. Samsung BlackJack Review | Check Prices
  26. Apple iPod (80GB) Test Report | Check Prices
  27. Yahoo Mail Beta Vendor Site
  28. TomTom One Review | Check Prices
  29. Dell UltraSharp 2407WFP Review | Check Prices
  30. Zoho Review
  31. Google Gmail Vendor Site
  32. Sling Media Slingbox Pro Check Prices
  33. Red Octane Guitar Hero 2 Video | Check Prices
  34. Google YouTube Vendor Site
  35. Mozilla Firefox 2 Download
  36. Google Picasa Download
  37. Nikon D80 Review | Check Prices
  38. Skype 3 Download
  39. Aliph Jawbone Review | Check Prices
  40. Shure E500PTH Review | Check Prices
  41. CyberPower Gamer Infinity Ultimate Review | Check Prices
  42. Asus w5fe-2P025E Review | Check Prices
  43. AVS Forum Web Site
  44. Yahoo Flickr Review
  45. Apple iPod Nano (8GB) Check Prices
  46. Nikon Coolpix S50c Check Prices
  47. Dell UltraSharp 2007WFP Review | Check Prices
  48. OCZ Trifecta Secure Digital Memory Card Check Prices
  49. Archos 704 Wi-Fi Review | Check Prices
  50. Lenovo ThinkPad X60 Tablet Review | Check
  51. ....

Friday, October 10, 2008

av-comparatives.org

Source (copied and extracted)
Danke für die gute Arbeit, Tyrolers!

You will find links to some products which may be of interest for corporations, enterprises, malware researchers, security professionals, administrators, universities, etc.
If you are a home user, you can ignore this section either because some of the tools listed here are VERY expensive and not adequate for home use, or because you simply do not need them (or are unable to use them). Click here for a list of anti-virus products for home users.
The products below are just an incomplete selection of some (mostly commercial) tools which we think could be useful for e.g. researchers or which are partially used also by us (together with many other internal and/or own developed tools).
Virtualization software:

Image software:

Must have software:

Other useful tools:

Note: some few websites above may contain „potentially dangerous programs“.
If you are unsure about the functions of some of the products above, do not install/run them, as they may pose a security riskIf you want to know if a file is malicious, forward it to your Anti-Virus product vendor and/or submit it to e.g. to some (multi-engine) file scan services, like e.g.:

Antivirus SW test (August 2008)

Vielen Dank für die harte Arbeit, Spezialisten von av-comparatives.org!
Source
Anti-Virus Comparative August 2008
by AV-Comparatives e.V. ® (www.av-comparatives.org)
Tested on Windows XP Professional SP3
Source
Retrospective / ProActive - Test May 2008
by AV-Comparatives (www.av-comparatives.org)
Tested on Windows XP Professional SP2

Security Software Testing Suite

Source
Security Software Testing Suite (SSTS) is a set of tools used for testing personal firewalls and Internet security suites for Windows.
SSTS is based on the idea of leak-tests, small independent programs that attempt to bypass an outbound protection of the security software. SSTS also consists of many independent programs that test specific features.
SSTS is used in our Firewall Challenge project, which goal is to rate and compare abilities of personal firewalls and similar software. This project replaced older Windows Personal Analysis project and its subproject – leak-testing. The advantages of using SSTS instead of the original leak-tests are obvious.
SSTS is published with its source code, which makes the testing as transparent as possible. Unlike leak-tests, this suite tests many other features of the security software and not just the outbound protection. The tests in SSTS have a unified structure and user interface, hence using it is faster, easier and more efficient.
Warning
: This software is used for testing of security products and should never be used on production machines.
Using this software may damage or erase your data. This software is provided "as is" and without warranty of any kind.
More information about each test can be found in its source code file and in the shared source code files of the whole suite.
By using SSTS you agree with its licence that is included in the archive in licence.txt.
Download SSTS

Firewall Challenge (the best personal firewall)

Source
The table below sorts the tested products by their total score, which is displayed in the Product score column. The second number in this column, separated by a slash, represents a number of tests that were in the system when the given product was tested, i.e. the number of tests with a valid test result value (other value than N/A). This table also shows the exact version of every tested product. The Level reached column presents the highest level that the product reached in Firewall Challenge. If it passed all levels, this number is suffixed with a plus sign. For products that score at least 80% in Firewall Challenge, the Recommendation column contains links to the online stores or products' webpages of the vendors that we have affiliate agreements with. If you click on any of these links and then buy the target product or other product offered on the target webpage, we will profit from it. This is one of the ways how you can support this project. The PDF document icon allows you to download the testing report in PDF format for the tested product.

Product
Product scoreLevel reachedProtection levelRecom-
mendation
Report
ico Outpost Firewall Pro 2009 6.5.2355.
316.0597
99% / 73 10 Excellent GET IT NOW! pdf
ico Online Armor Personal Firewall 2.1.0.131 98% / 73 10 Excellent GET IT NOW! pdf
ico Comodo Firewall Pro 3.0.22.349 95% / 73 10+ Excellent GET IT NOW! pdf
ico ProSecurity 1.43 93% / 62 10 Excellent N/A pdf
ico Privatefirewall 6.0.19.29 90% / 73 10+ Excellent GET IT NOW! pdf
ico Online Armor Personal Firewall 2.1.0.131 FREE 89% / 73 10 Very good GET IT NOW! pdf
ico Kaspersky Internet Security 2009 8.0.0.454 87% / 73 10+ Very good GET IT NOW! pdf
ico Netchina S3 2008 3.5.5.1FREE 86% / 73 9 Very good N/A pdf
ico ZoneAlarm Pro 2009 8.0.020.000 86% / 73 10+ Very good GET IT NOW! pdf
ico PC Tools Firewall Plus 4.0.0.45FREE 85% / 73 10+ Very good GET IT NOW! pdf
ico Jetico Personal Firewall 2.0.2.4.2264 78% / 73 7 Good Not recommended pdf
ico System Safety Monitor 2.3.0.612 77% / 62 7 Good Not recommended pdf
ico Norton Internet Security 2009 16.0.0.125 71% / 73 7 Good Not recommended pdf
ico Lavasoft Personal Firewall 3.0.2293.8822 70% / 73 7 Good Not recommended pdf
ico Dynamic Security Agent 2.0.11.22FREE 62% / 71 7 Poor Not recommended pdf
ico Webroot Desktop Firewall 5.5.10.20FREE 60% / 73 7 Poor Not recommended pdf
ico Comodo Firewall Pro 2.4.18.184FREE 55% / 73 7 Poor Not recommended pdf
ico Trend Micro Internet Security 2008 16.10.0.1106 27% / 73 4 None Not recommended pdf
ico G DATA InternetSecurity 2008 19% / 73 3 None Not recommended pdf
ico FortKnox Personal Firewall 2008 3.0.195.0 16% / 62 2 None Not recommended pdf
ico Look 'n' Stop 2.06 15% / 62 2 None Not recommended pdf
ico McAfee Internet Security 2009 10.0.209 12% / 73 2 None Not recommended pdf
ico F-Secure Internet Security 2008 8.00.101 12% / 73 2 None Not recommended pdf
ico Panda Internet Security 2008 12.01.00 12% / 73 2 None Not recommended pdf
ico Avira Premium Security Suite 8.1.00.206 11% / 70 2 None Not recommended pdf
ico Rising Personal Firewall 2008 20.59.10 11% / 73 2 None Not recommended pdf
ico BitDefender Internet Security 2009 12.0.10.2 7% / 73 1 None Not recommended pdf
ico Sunbelt Personal Firewall 4.6.1839.0 7% / 73 1 None Not recommended pdf
ico AVG Internet Security 8.0.93 6% / 62 1 None Not recommended pdf
ico Ashampoo FireWall FREE 1.20FREE 5% / 73 1 None Not recommended pdf
ico ESET Smart Security 3.0.621.0 5% / 62 1 None Not recommended pdf
ico Windows Live OneCare 2.0.2500.22 5% / 62 1 None Not recommended pdf
ico BullGuard Internet Security 8.0.0.13 4% / 70 1 None Not recommended pdf
ico iolo Personal Firewall 1.5.2.7 3% / 62 1 None Not recommended pdf
ico Filseclab Personal Firewall 3.0.3.8982FREE 3% / 73 1 None Not recommended pdf
ico Steganos Internet Security 2008 7.5.509 3% / 70 1 None Not recommended pdf
Interpretation of results
Outpost Firewall Pro 2009 6.5.2355.316.0597 leads the challenge with 99%, tightly followed by the paid version of Online Armor Personal Firewall 2.1.0.131 with 98% and
the best free product – Comodo Firewall Pro 3.0.22.349 with 95%
.
ProSecurity 1.43, which will be replaced by Real-time Defender in the future, is on the third place with 93%. Privatefirewall 6.0.19.29 scored 90%. All these products reached the Excellent protection level. Online Armor Personal Firewall 2.1.0.131 Free, Kaspersky Internet Security 2009 8.0.0.454, Netchina S3 2008 3.5.5.1, ZoneAlarm Pro 2009 8.0.020.000 and PC Tools Firewall Plus 4.0.0.45 are close to the excellent results.

Among the newly tested products, Privatefirewall 6.0.19.29, PC Tools Firewall Plus 4.0.0.40, Rising Personal Firewall 2008 20.59.10, BitDefender Internet Security 2009 12.0.10.2, McAfee Internet Security Suite 2008 9.1.108 and Ashampoo FireWall FREE 1.20 reached the best network performance results. The worst results were measured with G DATA InternetSecurity 2008 and Sunbelt Personal Firewall 4.6.1839.0.

It seems that Firewall Challenge tests make a big difference between really good products and the rest of the world. Most of the products are filtered in very low levels which means that they probably miss some critical features.