Microsoft MiniDump Dateien debuggen
Tausend Dank, Frank!
Wenn ein Windows Computer mit einem sogenannten Blue Screen Of Death (BSOD, Blauer Schirm des Todes) abstürzt, dann werden die Fehlerinformationen in einem Speicherabbild gespeichert. Dieses wird als Datei im Verzeichnis C:\Windows\Minidump abgelegt. Das Verzeichnis existiert in der normalen Windows-Ordnerstruktur nicht, sondern wird beim ersten BSOD angelegt.
Minidump-Dateien sind kompilierte Dateien, die man mit den Debugging Tools für Windows, die kostenlos auf der Microsoft-Seite verfügbar sind, öffnen, einsehen und interpretieren kann. Zusätzlich zu den Tools benötigen Sie noch Symbol-Dateien. Diese können Sie ebenfalls kostenlos von Microsoft herunter laden. Hier die Speicherorte:
- Debugging-Tools:
http://www.microsoft.com/whdc/devtools/debugging/default.mspx
(unter Using Debugging Tools for Windows finden Sie die Links zu den Downloads für Ihre jeweilige Plattform (x86 oder x64) - Symbols:
http://www.microsoft.com/whdc/devtools/debugging/symbolpkg.mspx
Bei den Symbol-Dateien müssen Sie sich die entsprechenden Dateien für das jeweilige Betriebssystem, das abgestürzt ist, herunterladen. Installieren Sie dann die Tools und danach die Symbols. Bitte beachten Sie auch, dass Sie mit einem 64-Bit Debugger sowohl 32-Bit als auch 64-Bit Dateien debuggen können, nicht aber mit einem 32-Bit Debugger 64-Bit Dateien (also Minidumps, die von 64-Bit Maschinen generiert wurden).
Den Windows-Debugger WinDbg einrichten
- Nach der Installation starten Sie das Programm WinDbg.
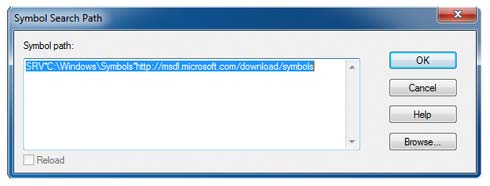
- Dann gehen Sie auf Files->Symbol File Path… (alternativ drücken Sie Strg+S)

- Hier geben Sie den folgenden Wert ein:
SRV*C:\Windows\Symbols*http://msdl.microsoft.com/download/symbols- Wobei Sie C:\Windows\Symbols bitte mit dem Pfad ersetzen, unter dem Sie die Symbols installiert haben.
- Hier geben Sie den folgenden Wert ein:
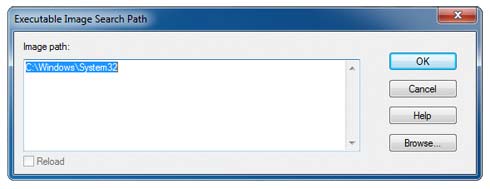
- Danach gehen Sie auf Files->Image File Path… (alternativ drücken Sie Strg+I)

- Hier geben Sie den folgenden Wert ein:
C:\Windows\System32- Wobei Sie C:\Windows durch das Windows-System-Verzeichnis ersetzen.
Die MiniDump Datei öffnen
- Gehen Sie auf Files->Open Crash Dump (alternativ drücken Sie Strg+D)
- Wählen Sie die .dmp Datei aus und öffnen Sie diese
- Der Debugger startet und verbindet sich mit der Datei. Sobald er fertig ist, sehen Sie am Ende des Vorgangs einen Link !analyze -v. Klicken Sie diesen und warten Sie den Debug-Vorgang ab.
Im Video ist die Erklärung wie Sie die Ergebnisse interpretieren können.
=================================
HOW TO: Debug Memory Dumps
(Figure out what is causing a BSOD)
When you get a stop error (Blue Screen of Death), your system writes a small file called a minidump. This is a small write up on how to debug memory dumps. This becomes extremely useful when you are trying to figure out what caused a particular stop error, and no filename was mentioned and/or it is undocumented.
You could always let Microsoft do it for you, but there is no gurantee they will answer, and it takes a very long time (over a month in my case).
Your first step is to make certain your computer is setup to record memory dumps. The small dumps are most desirable, because they aren't the size of your amount of ram!
Right click My Computer, choose properties. Click on the advanced tab, and then choose startup and recovery 'settings.' From the screenshot attached at the bottom you will see the settings you want. By default, this is largely how it is already setup; I only unchecked automatically restart for XP. For Vista, there is an extra step involved, you must click start, right click computer. Then from the next screen, click Advanced system settings. Then, its in the same location as XP. I have attached a Vista screenshot, as the options are a little different.
Note: Make certain that your pagefile still resides on the system partition, otherwise WIndows will not be able to save the debug files.
Your second step is to download and install the Microsoft Debugging Tools found here: http://www.microsoft.com/whdc/devtoo...nstallx86.mspx
Once you have downloaded and installed these tools, go to start, all programs, Debugging Tools For Windows, Windbg. Once you open Windbg, you will presented with a blank screen. Click on File, Symbol File Path. Here you will enter the symbols path. Symbols are needed to effectively debug.
The path will be:
SRV*c:\symbols*
http://msdl.microsoft.com/download/symbols
Enter in this path and click OK. Now, go to File, Save Workspace so that your symbols path is saved for future use. Now what you want to do is locate your memory dumps. They are usually located in %systemroot%/minidump (in my case C:/windows/minidump).
If you notice, they are usually named the date, and then a -*number* to indicate the order of minidumps that day. My example is called Mini061904-01.dmp (it happened today).
Inside of Windbg, go to File, Open Crash Dump and load the file. You will get a message to save base workspace information. Choose no.
Now you will get a debugging screen. Now it takes a little bit to run it, as the symbols have to be downloaded as they are needed. Then you will see information such as:
Symbol search path is: SRV*c:\symbols*
http://msdl.microsoft.com/download/symbols
Microsoft (R) Windows Debugger Version 6.3.0017.0
Copyright (c) Microsoft Corporation. All rights reserved.
Loading Dump File [C:\WINDOWS\Minidump\Mini061904-01.dmp]
Mini Kernel Dump File: Only registers and stack trace are available
Symbol search path is: SRV*c:\symbols*
Microsoft (R) Windows Debugger Version 6.3.0017.0
Copyright (c) Microsoft Corporation. All rights reserved.
Loading Dump File [C:\WINDOWS\Minidump\Mini061904-01.dmp]
Mini Kernel Dump File: Only registers and stack trace are available
Symbol search path is: SRV*c:\symbols*
f4198fc0 ?? ???
SYMBOL_STACK_INDEX: 1
FOLLOWUP_NAME: MachineOwner
SYMBOL_NAME: pavdrv51+7fc0
MODULE_NAME: pavdrv51
IMAGE_NAME: pavdrv51.sys
DEBUG_FLR_IMAGE_TIMESTAMP: 3e8c072b
STACK_COMMAND: kb
BUCKET_ID: 0x86427532_pavdrv51+7fc0
Followup: MachineOwner
---------
Update: After the intial run of the debug process, you can use the command !analyze -v to gather more information.
Now that may be more info than you need. This tutorial only covers minidumps, however, if needed, you could change your memory dump options to do a complete dump. This is useful, however, very cumbersome, as the file generated will be the same size as your amount of ram.
Note: Make absolutely sure that your symbol path is correct. If it isn't, then you will get symbol errors and not likely be able to debug the dump to get the info you desire.
I hope this info is useful, I find it invaluable to finding out what is causing random, sporadic, and/or obscure stop errors.
Once the above has been run then please attach your Mini-Dump in a text file (can use Notepad for this),
Here is a guide on how to attach the logs
==========
UPDATE
There is another utility called BlueScreenView that may make this process much easier. I have little experience with it,but check it out!
http://majorgeeks.com/BlueScreenView_d6200.html
There is another utility called BlueScreenView that may make this process much easier. I have little experience with it,but check it out!
http://majorgeeks.com/BlueScreenView_d6200.html


 LibreOffice
 Firefox
No comments:
Post a Comment