CPUBurn v1.4
PassMark BurnIn Test
PassMark BurnInTest™ is a software tool that allows all the major sub-systems of a computer to be simultaneously stress tested for endurance, reliability and stability.
Platforms:
Windows XP SP3, 2003 Server, Vista, 2008 Server, Windows 7, Windows 8 developer preview.
Available for both 32-bit and 64-bit platforms.
(Also available for Linux)
=============== ================
Intel Active Monitor v1.2.1
SpeedFan is a program that monitors voltages, fan speeds and temperatures in computers with hardware monitor chips. SpeedFan can even access S.M.A.R.T. info and show hard disk temperatures. SpeedFan supports SCSI disks too. SpeedFan can even change the FSB on some hardware (but this should be considered a bonus feature). SpeedFan can access digital temperature sensors and can change fan speeds accordingly, thus reducing noise. SpeedFan can find almost any hardware monitor chip connected to the 2-wire SMBus (System Management Bus (trademark belonging to SMIF, Inc.), a subset of the I2C protocol) and works fine with Windows 9x, ME, NT, 2000, 2003, XP, Vista and Windows 7. It works with Windows 64 bit too.
SpeedFan lets you take a deeper view at the status of your computer. Almost every computer includes support for hardware monitoring. Accessing digital temperature sensors is really useful. If you are trying to figure out why your PC hangs when under heavy load or after some hours of usage, SpeedFan might help you find the real cause. Very often it is a poor power supply, or an improperly installed heatsink that lead to behaviours that we tend to associate (incorrectly) with errors from the operating system. SpeedFan automatically searches your computer for informative chips: the hardware monitor chips. SpeedFan can display voltages, fan speeds and temperatures. On rare occasions, the BIOS doesn't activate such features. SpeedFan tries to enable them as long as this is a safe thing to do. Not only the motherboard is searched, but also some video cards and almost every currently sold hard disk. SpeedFan can access status info from EIDE, SATA and even SCSI drives, consistently showing internal data that can be used to diagnose current and future hard disk failures. This is known as S.M.A.R.T. (Self-Monitoring Analysis and Reporting Technology). At the lowest level, the SpeedFan hardware monitor software can access digital temperature sensors, but its main feature is its ability to control fan speeds according to the temperatures inside your PC, thus reducing noise.
SpeedFan can handle:
================ ================
================ ================
PCWizard is a powerful utility designed especially for detection of hardware, but also some more analysis. It's able to identify a large scale of system components and supports the latest technologies and standards. This tool is periodically updated (usually once per month) in order to provide most accurate results.
PC WIZARD is also an utility designed to analyze and benchmark your computer system. It can analyze and benchmark many kinds of hardware, such as CPU performance, Cache performance, RAM performance, Hard Disk performance, CD/DVD-ROM performance, Removable/FLASH Media performance, Video performance, MP3 compression performance.
Hardware Information
PROCESSOR : These benchmarks measure performance in terms of Integer Millions of Instructions Per Second (Integer MIPS) and Millions of Floating Point Operations Per Second (MFLOPS). The code behind these benchmarks method is written in Assembly (x86, x87, MMX, SSE, SSE2, SSE3, 3DNOW!). Processor benchmarks are HyperThreading, multi-processor (SMP) and multi-core (CMP) aware.
================ ================
PassMark BurnIn Test
PassMark BurnInTest™ is a software tool that allows all the major sub-systems of a computer to be simultaneously stress tested for endurance, reliability and stability.
- Assists in PC Troubleshooting and diagnostics.
- The best value professional burn-in tool on the market!
- The hottest, fastest CPU Burn In tool around! (See our CPU Heat Generation benchmark testing)
- Avoid delivering D.O.A. (Dead on Arrival) hardware to your customers.
- Dramatically reduce your burn in times with multithreaded simultaneous testing of components.
- Build your image as a supplier of quality systems.
- Avoid costly downtime, system rebuilds and lost data.
- Test the stability of a system after configuration changes or hardware upgrades (critical for overclocking).
Platforms:
Windows XP SP3, 2003 Server, Vista, 2008 Server, Windows 7, Windows 8 developer preview.
Available for both 32-bit and 64-bit platforms.
(Also available for Linux)
=============== ================
Intel Active Monitor v1.2.1
SpeedFan is a program that monitors voltages, fan speeds and temperatures in computers with hardware monitor chips. SpeedFan can even access S.M.A.R.T. info and show hard disk temperatures. SpeedFan supports SCSI disks too. SpeedFan can even change the FSB on some hardware (but this should be considered a bonus feature). SpeedFan can access digital temperature sensors and can change fan speeds accordingly, thus reducing noise. SpeedFan can find almost any hardware monitor chip connected to the 2-wire SMBus (System Management Bus (trademark belonging to SMIF, Inc.), a subset of the I2C protocol) and works fine with Windows 9x, ME, NT, 2000, 2003, XP, Vista and Windows 7. It works with Windows 64 bit too.
SpeedFan lets you take a deeper view at the status of your computer. Almost every computer includes support for hardware monitoring. Accessing digital temperature sensors is really useful. If you are trying to figure out why your PC hangs when under heavy load or after some hours of usage, SpeedFan might help you find the real cause. Very often it is a poor power supply, or an improperly installed heatsink that lead to behaviours that we tend to associate (incorrectly) with errors from the operating system. SpeedFan automatically searches your computer for informative chips: the hardware monitor chips. SpeedFan can display voltages, fan speeds and temperatures. On rare occasions, the BIOS doesn't activate such features. SpeedFan tries to enable them as long as this is a safe thing to do. Not only the motherboard is searched, but also some video cards and almost every currently sold hard disk. SpeedFan can access status info from EIDE, SATA and even SCSI drives, consistently showing internal data that can be used to diagnose current and future hard disk failures. This is known as S.M.A.R.T. (Self-Monitoring Analysis and Reporting Technology). At the lowest level, the SpeedFan hardware monitor software can access digital temperature sensors, but its main feature is its ability to control fan speeds according to the temperatures inside your PC, thus reducing noise.
SpeedFan can handle:
- almost any number of South Bridges
- almost any number of hardware monitor chips
- almost any number of hard disks
- almost any number of temperature readings
- almost any number of voltage readings
- almost any number of fan speed readings
- almost any number of PWMs
================ ================
================ ================
PCWizard is a powerful utility designed especially for detection of hardware, but also some more analysis. It's able to identify a large scale of system components and supports the latest technologies and standards. This tool is periodically updated (usually once per month) in order to provide most accurate results.
PC WIZARD is also an utility designed to analyze and benchmark your computer system. It can analyze and benchmark many kinds of hardware, such as CPU performance, Cache performance, RAM performance, Hard Disk performance, CD/DVD-ROM performance, Removable/FLASH Media performance, Video performance, MP3 compression performance.
Hardware Information
- Mainboard / Bios (Connectors, ID String, MP Support ...)
- Chipset (FSB Frequency, Norhtbridge, Hub, Direct Media Interface, XMB, NSI, ...)
- Main Memory (FPM, EDO, SDRAM, DDR SDRAM, DDR-2 SDRAM, DDR-3 SDRAM, RDRAM, FB_DIMM, Timings ...)
- Memory Profiles : EPP (SLi Ready), Intel XMP.
- Cache Memory (L1, L2, L3, Size, Frequency ...)
- Processors (Type, Speed, Multiplier coeff., Features, Model Number, Vanderpool Technology ...)
- Coprocessor
- APM & ACPI
- Busses : ISA, PCI, AGP (2x, 4x,8x), SMBus/ i2c, CardBus, Firewire, Hyper-Transport ... )
- DMI / SMBIOS
- Mainboard Sensors, Processor, Hard Disk & Battery (Voltage, Temperature, Fans)
- Video (Monitor, Card, Bios, Capabilities, Memory, Integrated Memory, Frequencies ...)
- OpenGL & 3Dfx
- DirectX (DirectDraw, Direct3D, DirectSound (3D), DirectMusic, DirectPlay, DirectInput, DirectX Media)
- Keyboard, Mouse & Joystick
- Drives (Hard Disk, Removable, CD-ROM, CDRW, DVD ...)
- SCSI (Card, Controller, Adapter, Devices ...)
- ATA/ATAPI & S-ATA (Devices, Type, Capabilities, S.M.A.R.T. Features, RAID)
- Ports (Serial, Parallel, USB, IEEE-1394)
- IDE & SCSI Devices
- Twain & WIA Devices
- PCMCIA (PC Card) Devices
- Bluetooth Devices
- Biometric Sensor Devices
- Sound Card (wave, midi, aux, mix, AC'97 codec, High Definition Audio)
- Printers (Local & Network)
- Modem (Features, Speed ...)
- Network (Server, Connexion, Firewall ...)
- Security (Scan Ports ...)
- PocketPC & SmartPhone Devices
- Virtual Machines
- MCI Devices (mpeg, avi, seq, vcr, video-disc, wave) & ACM
- SAPI
- Passwords (Outlook, Internet Explorer, MSN Messenger, Dialup ...)
- DOS Memory (base, HMA, UMB, XMS, EMS, DPMI, VCPI)
- Windows Memory
- Windows (Version, Product Key, Environment, Desktop, XP Themes ...)
- Windows UpTime (Boot, Shutdown, BlueScreen, System Restore Points ...)
- TrueType & OpenType Fonts
- WinSock (Internet), Telephony et Remote Access
- OLE (Objects, Servers ...)
- Microsoft© Applications
- Activity (Process, Tasks, Threads)
- Modules (DLL, DRV, 32 & 16-bits) & NT Services
- Internet Navigator (Microsoft Internet Explorer, Netscape, Mozilla, FireFox)
- .NET Global Assembly Cache (GAC)
- ODBC
- CMOS/RTC
- Resources (IRQ, DMA, E/S, Memory)
- System files (.ini, .log, .bat, .nt, .dos ...)
- Processor (Dhrystone (MIPS), Whetstone (MFLOPS), Mandelbrot fractal ...)
- L1, L2, L3 Cache, RAM (Bandwidth, Latency ...)
- Main Memory (Bandwidth, Latency ...)
- Hard Drives
- CD/DVD Rom
- DirectX
- Video
- Removable/Flash Support
- MP3 Compression
- VISTA Experience Index
PROCESSOR : These benchmarks measure performance in terms of Integer Millions of Instructions Per Second (Integer MIPS) and Millions of Floating Point Operations Per Second (MFLOPS). The code behind these benchmarks method is written in Assembly (x86, x87, MMX, SSE, SSE2, SSE3, 3DNOW!). Processor benchmarks are HyperThreading, multi-processor (SMP) and multi-core (CMP) aware.
================ ================
================ ================
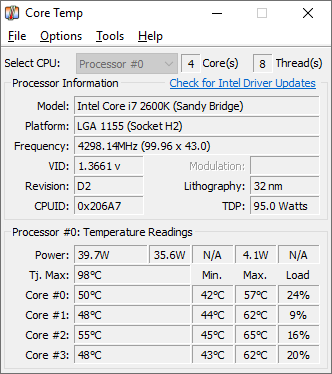 Core Temp is a compact, no fuss, small footprint, yet powerful program to monitor processor temperature and other vital information.
What makes Core Temp unique is the way it works. It is capable of displaying a temperature of each individual core of every processor in your system!
You can see temperature fluctuations in real time with varying workloads. Core Temp is also motherboard agnostic.
You can see temperature fluctuations in real time with varying workloads. Core Temp is also motherboard agnostic.
All major processor manufacturers have implemented a "DTS" (Digital Thermal Sensor) in their products. The DTS provides more accurate and higher resolution temperature readings than conventional onboard thermal sensors. (How does it work?).
This feature is supported by all recent x86 processors. Processors by Intel, AMD and VIA are supported. A complete list of supported processors is available.
Core Temp is easy to use, while also enabling a high level of customization and expandability.This feature is supported by all recent x86 processors. Processors by Intel, AMD and VIA are supported. A complete list of supported processors is available.
Core Temp provides a platform for plug-ins, which allows developers to add new features and extend its functionality. You can find our plug-ins and add-ons here.
| Description | Screenshot |
|---|
|
Core Temp Mobile is an app, currenly only available for Android. In conjunction with the Core Temp Remote Server, it allows you to monitor your machines outside of your home or office.
Download and installation instructions | 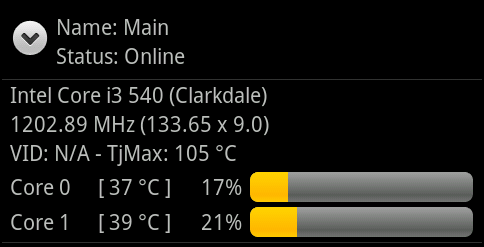 |
Core Temp Gadget 2.7
This is a sidebar gadget for Windows Vista and 7 for use in conjunction with Core Temp. There is not much to say about it, I think the screenshot speaks for itself.
the gadget requires Core Temp 0.99 or higher to be running for it to work. Download | 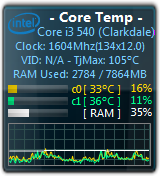 |
|
Core Temp MC is a Windows Media Center add on (supported in Vista and Windows 7) which allows the user to view the status of their processor directly from Windows Media Center's UI.
Download | 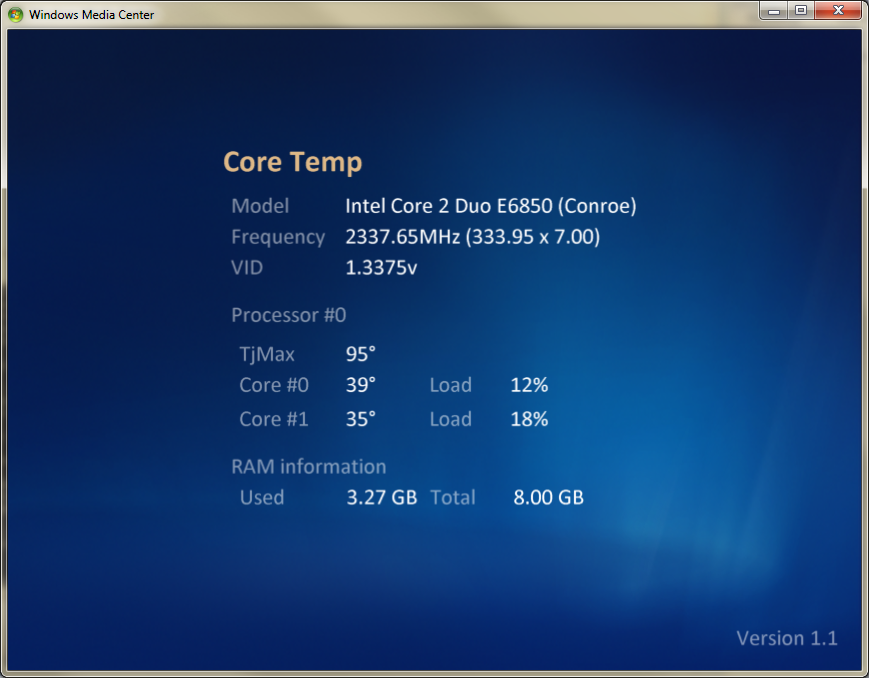 |
|
Core Temp Grapher comes as a plug-in (dll) or standalone (exe). It will display a graph per processor core displaying the load percentage and core temperature. For best results with the Grapher, you should use the latest Core Temp version available.
Setup and usage instructions can be found in the "readme.txt" file. Download plug-in: 32 bit 64 bit | 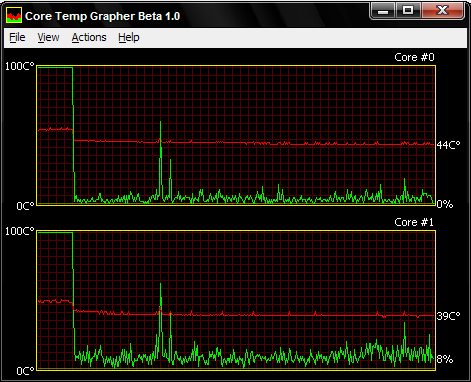 |
|
This plug-in allows applications to connect over a network to Core Temp and recieve updates on your processor's status, similar to the sidebar gadget.
It's a required plug-in for Core Temp Mobile Requirements: Windows XP SP2 or higher + .Net Framework 3.5. Download | 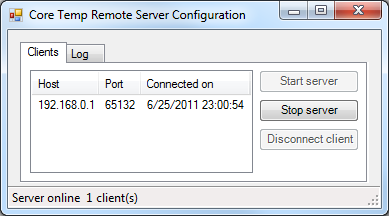 |
|
An addon for the "SystemInfo" script. It requires Core Temp 0.99 or higher to be running to work properly.
The installation instructions are inside. Download | 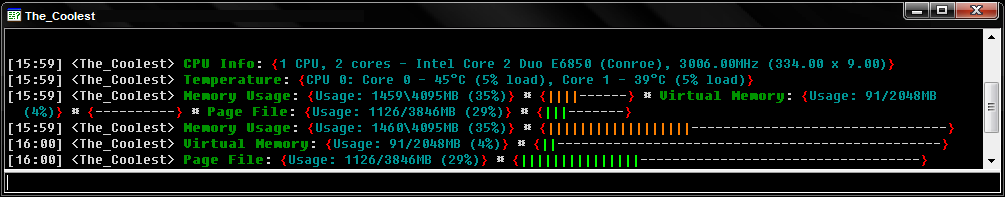 |
"VCTemp is an open-source tool that interfaces with CoreTemp to allow you to view the temperatures on a remote machine.
This can be useful to keep an eye on processor temperatures of your rig while fullscreen gaming." DISCLAIMER: VCTemp is a third party tool, and any questions, suggestions, bug reports and complaints should be directed to the developer. |


 Firefox
No comments:
Post a Comment